数据来源:tushare A股日线行情
1
2
3
4
5
6
7
8
9
10
11
import tushare as tsimport numpy as npts.set_token('4e542e2517c15f3ef8b5d5f53c50ed43b501c0952dfeeda41dbdbd4e' ) pro = ts.pro_api() from matplotlib import font_managerfont = font_manager.FontProperties(fname="/usr/share/fonts/Fonts/simsun.ttc" ) import matplotlib.pyplot as plt
交易日每天15点~16点之间入库,使用5家上市企业8月1日到9月1日的A股日线行情深圳证券交易所数据。
1 2 3 4 5 6 7 8 9 10 11 12 data1=pro.daily(ts_code='002594.SZ' ,start_date='20240801' ,end_date='20240901' ) qiye1=np.array(data1['close' ]) data2=pro.daily(ts_code='300124.SZ' ,start_date='20240801' ,end_date='20240901' ) qiye2=np.array(data2['close' ]) data3=pro.daily(ts_code='002460.SZ' ,start_date='20240801' ,end_date='20240901' ) qiye3=np.array(data3['close' ]) data4=pro.daily(ts_code='300750.SZ' ,start_date='20240801' ,end_date='20240901' ) qiye4=np.array(data4['close' ]) data5=pro.daily(ts_code='300014.SZ' ,start_date='20240801' ,end_date='20240901' ) qiye5=np.array(data5['close' ])
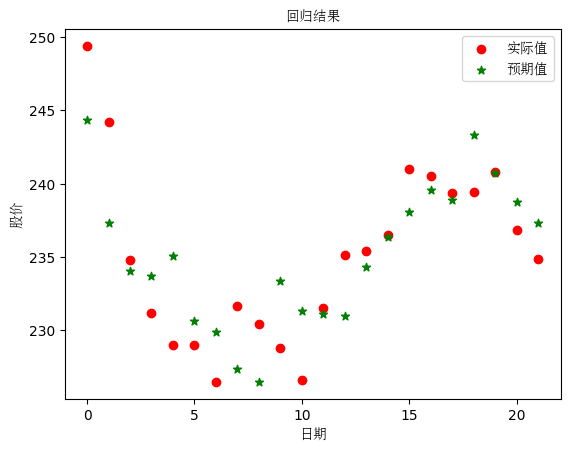
一、 最小二乘法 使用 sklearn 的 linear_model.LinearRegression() 包,以四家企业股票数据作为输入数据 X,以比亚迪股票数据作为 y,预测比亚迪股票。
1
2
3
4
5
6
7
8
9
10
11
12
13
14
15
16
17
18
19
20
21
22
23
24
25
26
27
from sklearn import linear_modelreg = linear_model.LinearRegression() x=[] y=[] for i in range (len (qiye1)): x.append([qiye2[-i],qiye3[-i],qiye4[-i],qiye5[-i]]) y.append(qiye1[-i]) reg.fit(x,y) print (reg.coef_)print (reg.intercept_)plt.scatter(range (len (qiye1)),y,c="red" , marker='o' , label='实际值' ) plt.scatter(range (len (qiye1)),reg.predict(x), c="green" , marker='*' , label='预期值' ) plt.xlabel('日期' , fontproperties=font) plt.ylabel('股价' , fontproperties=font) plt.legend(prop=font) plt.title("回归结果" , fontproperties=font) plt.show()
[-1.10978233  4.1781369   0.83544054 -0.43331279]
38.73142244793675
二、 梯度下降法 实验原理 使用sklearn 的 linear_model.SGDRegressor 包,以四家企业股票数据作为输入数据 X,以比亚迪股票数据作为 y,预测比亚迪股票。
实验细节 学习率设置为0.0001
划分数据集 1 2 3 4 X_train_sta = standardScaler.fit_transform(X[0 :-10 ]) X_test_sta = standardScaler.transform(X[-10 :]) y_train_sta = y[0 :-10 ] y_test_sta = y[-10 :]
将数据的后10维作为验证集,将之前的数据分为训练集,对训练集归一化,进行训练。
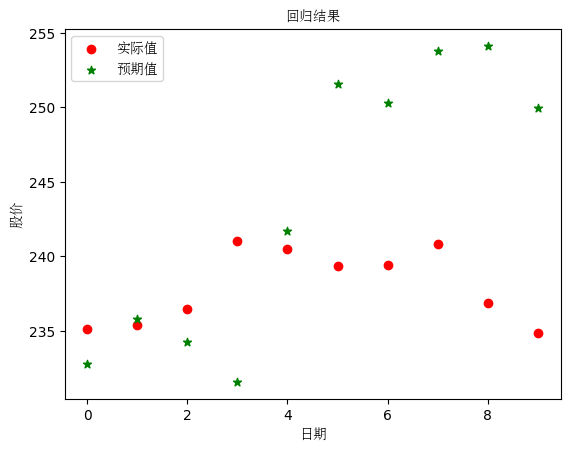
1 2 3 4 5 6 7 8 9 10 11 12 13 14 15 16 17 18 19 20 21 22 23 24 25 26 27 28 29 30 31 32 33 from sklearn.linear_model import SGDRegressorfrom sklearn.preprocessing import StandardScalerstandardScaler = StandardScaler() X_train_sta = standardScaler.fit_transform(x[0 :-10 ]) X_test_sta = standardScaler.transform(x[-10 :]) y_train_sta = y[0 :-10 ] y_test_sta = y[-10 :] sgd_reg = SGDRegressor(alpha=0.0001 ) sgd_reg.fit(X_train_sta, y_train_sta) print (sgd_reg.score(X_test_sta, y_test_sta))print (sgd_reg.coef_)print (sgd_reg)plt.scatter(range (10 ), y_test_sta, c="red" , marker='o' , label='实际值' ) plt.scatter(range (10 ), sgd_reg.predict(X_test_sta), c="green" , marker='*' , label='预期值' ) plt.xlabel('日期' , fontproperties=font) plt.ylabel('股价' , fontproperties=font) plt.legend(prop=font) plt.title("回归结果" , fontproperties=font) plt.show()
-18.168003628434395
[ 0.84155388 -1.30852736 4.97132202 -2.00460589]
SGDRegressor()
实验结果 回归系数为:[ 0.74271056 -1.21307246 4.97542077 -1.95273362]
实验结果可视化:
将测试集与预测结果表示在图中,红点为比亚迪连续十天股票,绿色为股票预测值,可以看出相关性较强。
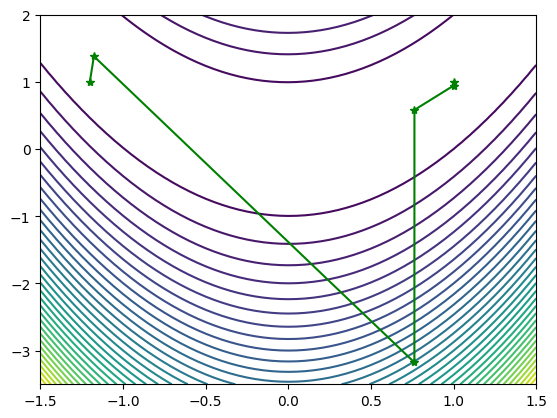
三、 牛顿法 实验思路 随机初始化数据,使用牛顿法拟合函数
数据为:
1 2 X1 = np.arange(-1.5 , 1.5 + 0.05 , 0.05 ) X2 = np.arange(-3.5 , 2 + 0.05 , 0.05 )
实际函数:
1 f = 100 * (x2 - x1 ** 2 ) ** 2 + (1 - x1) ** 2
预测函数表达式:
1 fun = lambda x: 100 * (x[0 ] ** 2 - x[1 ]) ** 2 + (x[0 ] - 1 ) ** 2
梯度向量:
1 gfun = lambda x: np.array([400 * x[0 ] * (x[0 ] ** 2 - x[1 ]) + 2 * (x[0 ] - 1 ), -200 * (x[0 ] ** 2 - x[1 ])])
海森矩阵:
1 hess = lambda x: np.array([[1200 * x[0 ] ** 2 - 400 * x[1 ] + 2 , -400 * x[0 ]], [-400 * x[0 ], 200 ]])
初始点设置为:
1 x0 = np.array([-1.2 , 1 ])
最大迭代次数:
迭代结束条件:
1 2 3 4 5 6 7 8 9 10 11 12 13 14 15 16 17 18 19 20 21 22 23 24 25 26 27 28 29 30 31 32 33 34 35 36 37 38 39 40 41 42 43 44 45 46 47 48 49 50 51 52 53 54 55 56 57 58 import randomdef dampnm (fun, gfun, hess, x0 ): maxk = 500 rho = 0.55 sigma = 0.4 k = 0 epsilon = 1e-5 with open ("牛顿.txt" , "w" ) as f: W = np.zeros((2 , 20000 )) while k < maxk: W[:, k] = x0 gk = gfun(x0) Gk = hess(x0) dk = -1.0 * np.linalg.solve(Gk, gk) print (k, np.linalg.norm(dk)) f.write(str (k) + ' ' + str (np.linalg.norm(gk)) + "\n" ) if np.linalg.norm(dk) < epsilon: break x0 += dk k += 1 W = W[:, 0 :k + 1 ] return x0, fun(x0), k, W fun = lambda x: 100 * (x[0 ] ** 2 - x[1 ]) ** 2 + (x[0 ] - 1 ) ** 2 gfun = lambda x: np.array([400 * x[0 ] * (x[0 ] ** 2 - x[1 ]) + 2 * (x[0 ] - 1 ), -200 * (x[0 ] ** 2 - x[1 ])]) hess = lambda x: np.array([[1200 * x[0 ] ** 2 - 400 * x[1 ] + 2 , -400 * x[0 ]], [-400 * x[0 ], 200 ]]) X1 = np.arange(-1.5 , 1.5 + 0.05 , 0.05 ) X2 = np.arange(-3.5 , 2 + 0.05 , 0.05 ) [x1, x2] = np.meshgrid(X1, X2) f = 100 * (x2 - x1 ** 2 ) ** 2 + (1 - x1) ** 2 plt.contour(x1, x2, f, 40 ) x0 = np.array([-1.2 , 1 ]) out = dampnm(fun, gfun, hess, x0) print ("迭代次数:" ,out[2 ])print ("解:" ,out[0 ])W = out[3 ] print ("迭代过程中点的变化:" )print (W[:, :])plt.plot(W[0 , :], W[1 , :], 'g*-' ) plt.show()
0 0.38147588128083515
1 4.950944723225031
2 3.757858643431574
3 0.4317760753882379
4 0.055964067473696845
5 9.624777931040847e-06
迭代次数: 5
解: [0.9999957  0.99999139]
迭代过程中点的变化:
[[-1.2        -1.1752809   0.76311487  0.76342968  0.99999531  0.9999957 ]
 [ 1.          1.38067416 -3.17503385  0.58282478  0.94402732  0.99999139]]
实验结果 迭代次数和loss:1 2 3 4 5 6 0 232.86768775422664 1 4.639426214066757 2 1370.789849446618 3 0.47311037910599685 4 25.027445596686427 5 8.60863341775635e-06


