1
2
3
import numpy as npimport pandas as pdimport matplotlib.pyplot as plt
1
2
3
4
data = pd.read_csv("../data/Turbine_Data.csv" , low_memory=False , parse_dates=["Unnamed: 0" ]) data.tail()
Unnamed: 0
ActivePower
AmbientTemperatue
BearingShaftTemperature
Blade1PitchAngle
Blade2PitchAngle
Blade3PitchAngle
ControlBoxTemperature
GearboxBearingTemperature
GearboxOilTemperature
...
GeneratorWinding2Temperature
HubTemperature
MainBoxTemperature
NacellePosition
ReactivePower
RotorRPM
TurbineStatus
WTG
WindDirection
WindSpeed
118219
2020-03-30 23:10:00+00:00
70.044465
27.523741
45.711129
1.515669
1.950088
1.950088
0.0
59.821165
55.193793
...
58.148777
39.008931
36.476562
178.0
13.775785
9.234004
2.0
G01
178.0
3.533445
118220
2020-03-30 23:20:00+00:00
40.833474
27.602882
45.598573
1.702809
2.136732
2.136732
0.0
59.142038
54.798545
...
57.550367
39.006759
36.328125
178.0
8.088928
9.229370
2.0
G01
178.0
3.261231
118221
2020-03-30 23:30:00+00:00
20.777790
27.560925
45.462045
1.706214
2.139664
2.139664
0.0
58.439439
54.380456
...
57.099335
39.003815
36.131944
178.0
4.355978
9.236802
2.0
G01
178.0
3.331839
118222
2020-03-30 23:40:00+00:00
62.091039
27.810472
45.343827
1.575352
2.009781
2.009781
0.0
58.205413
54.079014
...
56.847239
39.003815
36.007805
190.0
12.018077
9.237374
2.0
G01
190.0
3.284468
118223
2020-03-30 23:50:00+00:00
68.664425
27.915828
45.231610
1.499323
1.933124
1.933124
0.0
58.581716
54.080505
...
56.741040
39.003815
35.914062
203.0
14.439669
9.235532
2.0
G01
203.0
3.475205
5 rows × 22 columns
<class 'pandas.core.frame.DataFrame'>
RangeIndex: 118224 entries, 0 to 118223
Data columns (total 22 columns):
 #   Column                        Non-Null Count   Dtype
---  ------                        --------------   -----
 0   Unnamed: 0                    118224 non-null  datetime64[ns, UTC]
 1   ActivePower                   94750 non-null   float64
 2   AmbientTemperatue             93817 non-null   float64
 3   BearingShaftTemperature       62518 non-null   float64
 4   Blade1PitchAngle              41996 non-null   float64
 5   Blade2PitchAngle              41891 non-null   float64
 6   Blade3PitchAngle              41891 non-null   float64
 7   ControlBoxTemperature         62160 non-null   float64
 8   GearboxBearingTemperature     62540 non-null   float64
 9   GearboxOilTemperature         62438 non-null   float64
 10  GeneratorRPM                  62295 non-null   float64
 11  GeneratorWinding1Temperature  62427 non-null   float64
 12  GeneratorWinding2Temperature  62449 non-null   float64
 13  HubTemperature                62406 non-null   float64
 14  MainBoxTemperature            62507 non-null   float64
 15  NacellePosition               72278 non-null   float64
 16  ReactivePower                 94748 non-null   float64
 17  RotorRPM                      62127 non-null   float64
 18  TurbineStatus                 62908 non-null   float64
 19  WTG                           118224 non-null  object
 20  WindDirection                 72278 non-null   float64
 21  WindSpeed                     94595 non-null   float64
dtypes: datetime64[ns, UTC](1), float64(20), object(1)
memory usage: 19.8+ MB
1
2
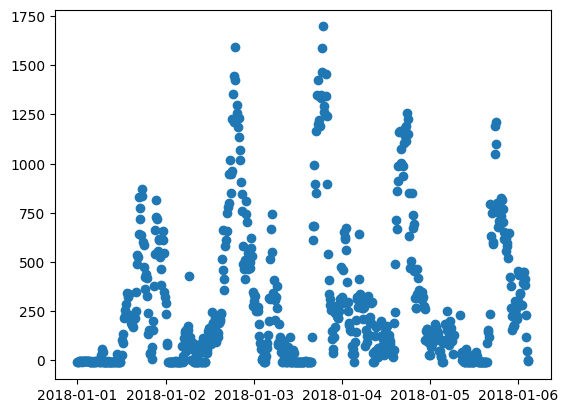
ig, ax = plt.subplots() ax.scatter(data["Unnamed: 0" ][:1000 ], data["ActivePower" ][:1000 ])
<matplotlib.collections.PathCollection at 0x72912e32a800>
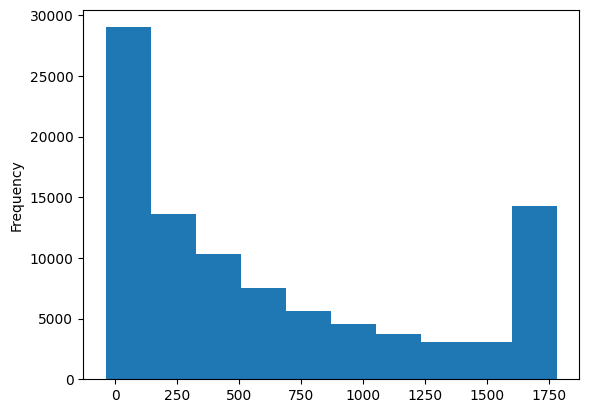
1 data.ActivePower.plot.hist()
<Axes: ylabel='Frequency'>
1 2 3 4 data['DateTime' ] = data['Unnamed: 0' ] data.drop('Unnamed: 0' , axis=1 , inplace=True ) data['DateTime' ].head(20 )
0    2017-12-31 00:00:00+00:00
1    2017-12-31 00:10:00+00:00
2    2017-12-31 00:20:00+00:00
3    2017-12-31 00:30:00+00:00
4    2017-12-31 00:40:00+00:00
5    2017-12-31 00:50:00+00:00
6    2017-12-31 01:00:00+00:00
7    2017-12-31 01:10:00+00:00
8    2017-12-31 01:20:00+00:00
9    2017-12-31 01:30:00+00:00
10   2017-12-31 01:40:00+00:00
11   2017-12-31 01:50:00+00:00
12   2017-12-31 02:00:00+00:00
13   2017-12-31 02:10:00+00:00
14   2017-12-31 02:20:00+00:00
15   2017-12-31 02:30:00+00:00
16   2017-12-31 02:40:00+00:00
17   2017-12-31 02:50:00+00:00
18   2017-12-31 03:00:00+00:00
19   2017-12-31 03:10:00+00:00
Name: DateTime, dtype: datetime64[ns, UTC]
1 2 3 4 5 6 7 8 9 10 data['DateTime' ] = pd.to_datetime(data['DateTime' ], format = '%Y-%m-%dT%H:%M:%SZ' , errors = 'coerce' ) data['year' ] = data['DateTime' ].dt.year data['month' ] = data['DateTime' ].dt.month data['day' ] = data['DateTime' ].dt.day data['hour' ] = data['DateTime' ].dt.hour data['minute' ] = data['DateTime' ].dt.minute data.drop('DateTime' , axis=1 , inplace= True )
ActivePower
AmbientTemperatue
BearingShaftTemperature
Blade1PitchAngle
Blade2PitchAngle
Blade3PitchAngle
ControlBoxTemperature
GearboxBearingTemperature
GearboxOilTemperature
GeneratorRPM
...
RotorRPM
TurbineStatus
WTG
WindDirection
WindSpeed
year
month
day
hour
minute
0
NaN
NaN
NaN
NaN
NaN
NaN
NaN
NaN
NaN
NaN
...
NaN
NaN
G01
NaN
NaN
2017
12
31
0
0
1
NaN
NaN
NaN
NaN
NaN
NaN
NaN
NaN
NaN
NaN
...
NaN
NaN
G01
NaN
NaN
2017
12
31
0
10
2
NaN
NaN
NaN
NaN
NaN
NaN
NaN
NaN
NaN
NaN
...
NaN
NaN
G01
NaN
NaN
2017
12
31
0
20
3
NaN
NaN
NaN
NaN
NaN
NaN
NaN
NaN
NaN
NaN
...
NaN
NaN
G01
NaN
NaN
2017
12
31
0
30
4
NaN
NaN
NaN
NaN
NaN
NaN
NaN
NaN
NaN
NaN
...
NaN
NaN
G01
NaN
NaN
2017
12
31
0
40
...
...
...
...
...
...
...
...
...
...
...
...
...
...
...
...
...
...
...
...
...
...
118219
70.044465
27.523741
45.711129
1.515669
1.950088
1.950088
0.0
59.821165
55.193793
1029.870744
...
9.234004
2.0
G01
178.0
3.533445
2020
3
30
23
10
118220
40.833474
27.602882
45.598573
1.702809
2.136732
2.136732
0.0
59.142038
54.798545
1030.160478
...
9.229370
2.0
G01
178.0
3.261231
2020
3
30
23
20
118221
20.777790
27.560925
45.462045
1.706214
2.139664
2.139664
0.0
58.439439
54.380456
1030.137822
...
9.236802
2.0
G01
178.0
3.331839
2020
3
30
23
30
118222
62.091039
27.810472
45.343827
1.575352
2.009781
2.009781
0.0
58.205413
54.079014
1030.178178
...
9.237374
2.0
G01
190.0
3.284468
2020
3
30
23
40
118223
68.664425
27.915828
45.231610
1.499323
1.933124
1.933124
0.0
58.581716
54.080505
1029.834789
...
9.235532
2.0
G01
203.0
3.475205
2020
3
30
23
50
118224 rows × 26 columns
ActivePower                     23474
AmbientTemperatue               24407
BearingShaftTemperature         55706
Blade1PitchAngle                76228
Blade2PitchAngle                76333
Blade3PitchAngle                76333
ControlBoxTemperature           56064
GearboxBearingTemperature       55684
GearboxOilTemperature           55786
GeneratorRPM                    55929
GeneratorWinding1Temperature    55797
GeneratorWinding2Temperature    55775
HubTemperature                  55818
MainBoxTemperature              55717
NacellePosition                 45946
ReactivePower                   23476
RotorRPM                        56097
TurbineStatus                   55316
WTG                                 0
WindDirection                   45946
WindSpeed                       23629
year                                0
month                               0
day                                 0
hour                                0
minute                              0
dtype: int64
1 2 3 4 5 6 for label, content in data.items(): if pd.api.types.is_numeric_dtype(content): if pd.isnull(content).sum (): data[label+"_is_missing" ] = pd.isnull(content) data[label] = content.fillna(content.median())

